Four reports, and the figures behind each one.
A report is only useful if you can take it to a board meeting and answer the follow-up question. Each of these exports the same object the screen is reading, so the spreadsheet and the screen can never disagree.
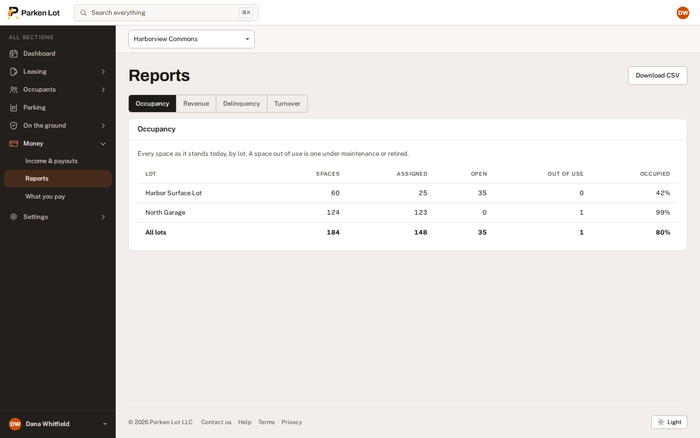
What a building actually asks
How full are we, what did we collect, who has not paid, and how much movement is there. Four questions, four reports, no dashboard builder.
- Occupancy by area, level and type — which tells you what to build, not just how full you are.
- Revenue against what was billed, so the gap is visible rather than inferred.
- Delinquency by household and by age.
- Turnover, which is the number that predicts next quarter’s work.
Questions about reporting.
Can we get a PDF?
CSV today, from the same figures on screen. PDF export is on the roadmap and is not shipped.
Can we report across several properties?
Yes — the selector at the top of every page aggregates across everything you hold, or narrows to one.
The rest of it.
Digital permits
A permit on a phone, checked from a plate or a code in about three seconds.
How it worksGuest passes
Residents request, you approve or decline, and the pass prices itself by the day, week or month.
How it worksEnforcement
Warnings, citations and disputes, with a photograph and a grace period stamped at the moment of observation.
How it worksOne plan, per space, per month.
Everything on this page is included. Describe your lot and see the number for your own building.